Let’s take a look at the RICE Scoring Model. This is a way for you to grade all the possible things you could be spending time on in your business so you can determine what to focus on.
I use this tool to find what my team and I should be spending time on based on data. I love being productive and backing my decisions with data, so I love the RICE Scoring Method.
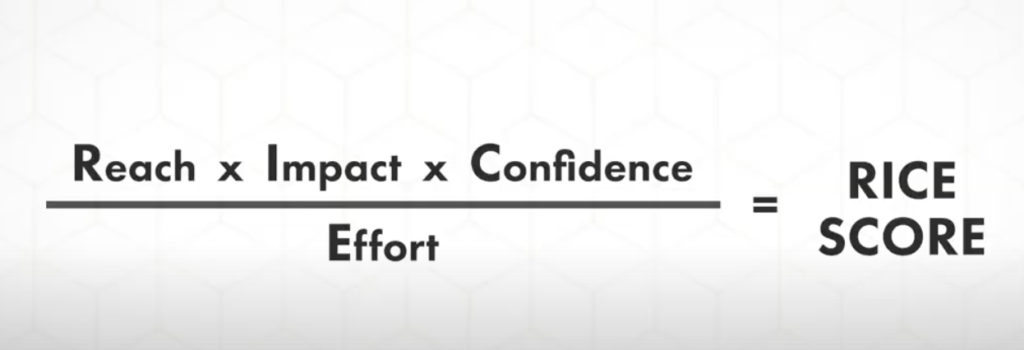
RICE – REACH, IMPACT, CONFIDENCE, EFFORT
I’ll explain the formula, so keep in mind that it exposes the things you can do that will give you the most leverage on your time. It also exposes the things that would be the most unleveraged use of your time – things that would require the most effort for the least amount of benefit.
First, let’s define each part of the RICE acronym, and then I’ll show you how the formula and calculation works.
REACH
Reach represents the number of people that will be affected during a certain period of time. The RICE Scoring Model was developed at a software company, Intercom, and in that original context, they were looking at how many customers a potential product change or new feature would impact over the next quarter.
You can apply this to your business in any way that makes sense. If you’re on a fulfillment team, reach might mean the number of customers that would be affected. If you’re on a sales or marketing team, reach might mean the number of leads that would be affected. You can look at the number per month, per quarter, per year, etc. Just make sure you’re consistent across everything you’re scoring.
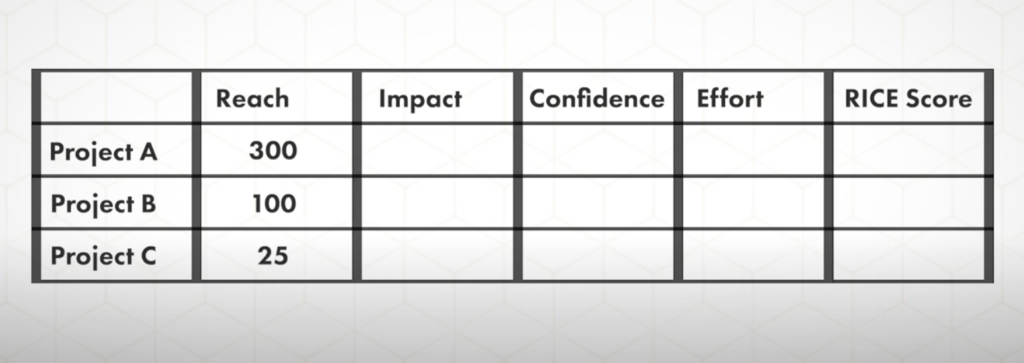
Let’s take a look at an example:
Project A will impact 300 leads during the next quarter, Project B will impact 100 leads during the next quarter, and Project C will impact 25 leads during the next quarter.
We’ll continue with this example as we work our way through the method.
IMPACT
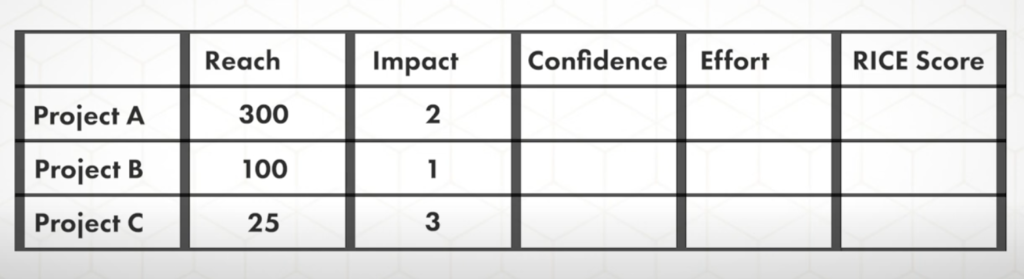
Impact is a measure of how much each person from your Reach metric will be impacted. You score this on a scale from 0-3 with 3 being massive impact, 2 being high impact, 1 being medium impact, .5 being low impact, and .25 being minimal impact.
For my example, I’ll ask, “How much will each potential project increase conversion rate when a lead encounters it?” Yes, this is somewhat subjective. You need to make your best estimate. It may not be perfect, but it’s better than the alternative of just working on whatever it is you feel like at any given moment. You’ll see how this all comes together soon enough.
Project A will have a high impact, so I give it a 2. Project B will have a medium impact, so it gets a 1. Project C will have a massive impact on those 25 leads, so it gets a score of 3.
CONFIDENCE
Confidence is a measure of how confident you are in your estimates. If you give something a high reach or high impact score, but you don’t really have the data to back it up, then you would give that project a low confidence score. If your estimates are based on a lot of research and facts, then that project would get a high confidence score.
The confidence score is a percentage, so it is measured 0-100%.
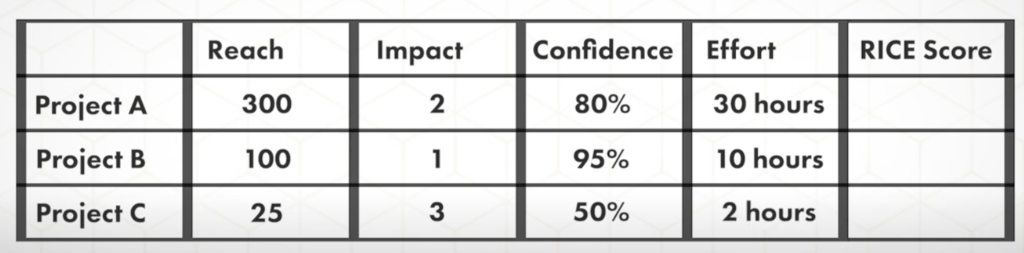
In my example, my confidence in Project A’s estimates is 80%. My confidence in Project B’s estimates is 95%. My confidence in Project C’s estimates is 50%. Not very confident, but not so low that it’s a wild guess either.
EFFORT
Effort is the amount of work required to complete each project. This could be the amount of work required by your entire team or this could be the amount of work required just by you if you’re using this model to score personal projects.
In the original RICE Model developed by Intercome, effort is measured person-months, which is the amount of work one person can do in one month. This would give you scores like 4 person-months, 1/2 person-months, 10 person-months, etc. This makes sense with bigger teams working on bigger projects.
When I use RICE in my business, I’m not scoring projects that are THAT large so I find it easier to score effort based on the number of hours something may take. It doesn’t matter what timeframe you use as long as you’re consistent across everything you’re scoring.
You wouldn’t rate one project in hours and the other in person-months.
To continue this example, Project A will take 30 hours, Project B will take 10 hours, and Project C will take 2 hours.
Now, the last thing to do is put these numbers into the RICE Formula.
A good way to set this up is on a spreadsheet. You would just plug this formula into the end of each row. Now I have real evidence backed by data of what I should be spending my time on.
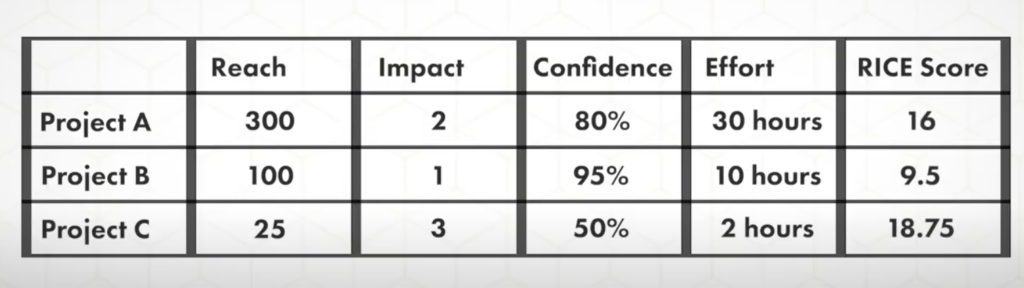
You’re usually going to be scoring more than three possible projects and you’ll often end up with some surprises. In this case, I can see that I should start with Project C because even though it will only impact 25 leads during the next quarter, and even though my confidence in the estimates is low, I’m estimating a high impact on those leads and a relatively small amount of effort. So, Project C is where I should start.
Project B has the lowest RICE score. So, even though Project A will take 3x as long, I should do Project A next. It has a higher RICE score because it will impact more leads and the level of impact will be greater.
And that’s it! Once you figure out the numbers, the numbers will tell you what to do!